Explaining how the Kp index relates to geomagnetic activity and the Northern Lights
The Kp-index is used to characterise and describe the magnitude of geomagnetic disturbance caused by solar wind interacting with Earth’s magnetic field on a scale from 0-9. Contrary to what many people think, the Kp index does not describe how intense or bright the Northern Lights will become. It is therefore not very useful for aurora chasers in the field.
The Kp value is determined by averaging global magnetic measurements over three hour intervals, from 09-12, 12-15, 15-18 etc. Data is collected by mid latitude Earth-based magnetic observatories and used to make predictions based on the days and weeks past.
Each value in the index is as following:
0 Quiet
1 Quiet
2 Unsettled
3 Unsettled
4 Active
5 Minor storm (G1)
6 Moderate storm (G2)
7 Strong storm (G3)
8 Severe storm (G4)
9 Extreme storm (G5)
The letter K is from the German word Kennziffer which means "characteristic digit" while p stands for planetary. The scale was developed in 1949 by Julius Bartelsand.
Honestly, the Kp-index is not a very useful indicator for aurora chasers. In fact, one of the biggest mistake aurora chasers and tour companies make is relying too heavily on it.
At best, the predicted Kp-value can give you a rough idea of what to expect, and so it can be handy for planning.
If the predicted Kp-value for a given night is 1, it is unlikely you’ll see a very dramatic aurora display. However, if the predicted Kp-value is 5, you might see a more beautiful show. However, this is a bit more complicated.
Auroras occur around the world the aurora oval. Regional substorms, which are flare-ups within this oval, cannot be captured by a global Kp value. And substorms are when the northern lights are at their most beautiful.
When you are outside chasing auroras, it is way more useful to look at the real time space weather data, the speed and density of the solar wind (high is good), it's Bz-level (Bz south is good) and the local magnetic disturbance at Leirvogur Magnetic Observatory (more shaking is better).
On a quiet night, a favourable Bz south component of the solar wind can lead to a lovely display seemingly out of nowhere. For 10-30 minutes on average, the activity might increase such that beautiful Northern Lights can be seen. At that particular moment, the measured local K-value is a lot higher than the resulting global Kp-average of the same three hour interval.
It’s like measuring the average wind speed between three hours. A sudden increase in activity doesn’t necessarily have a large effect on the average.
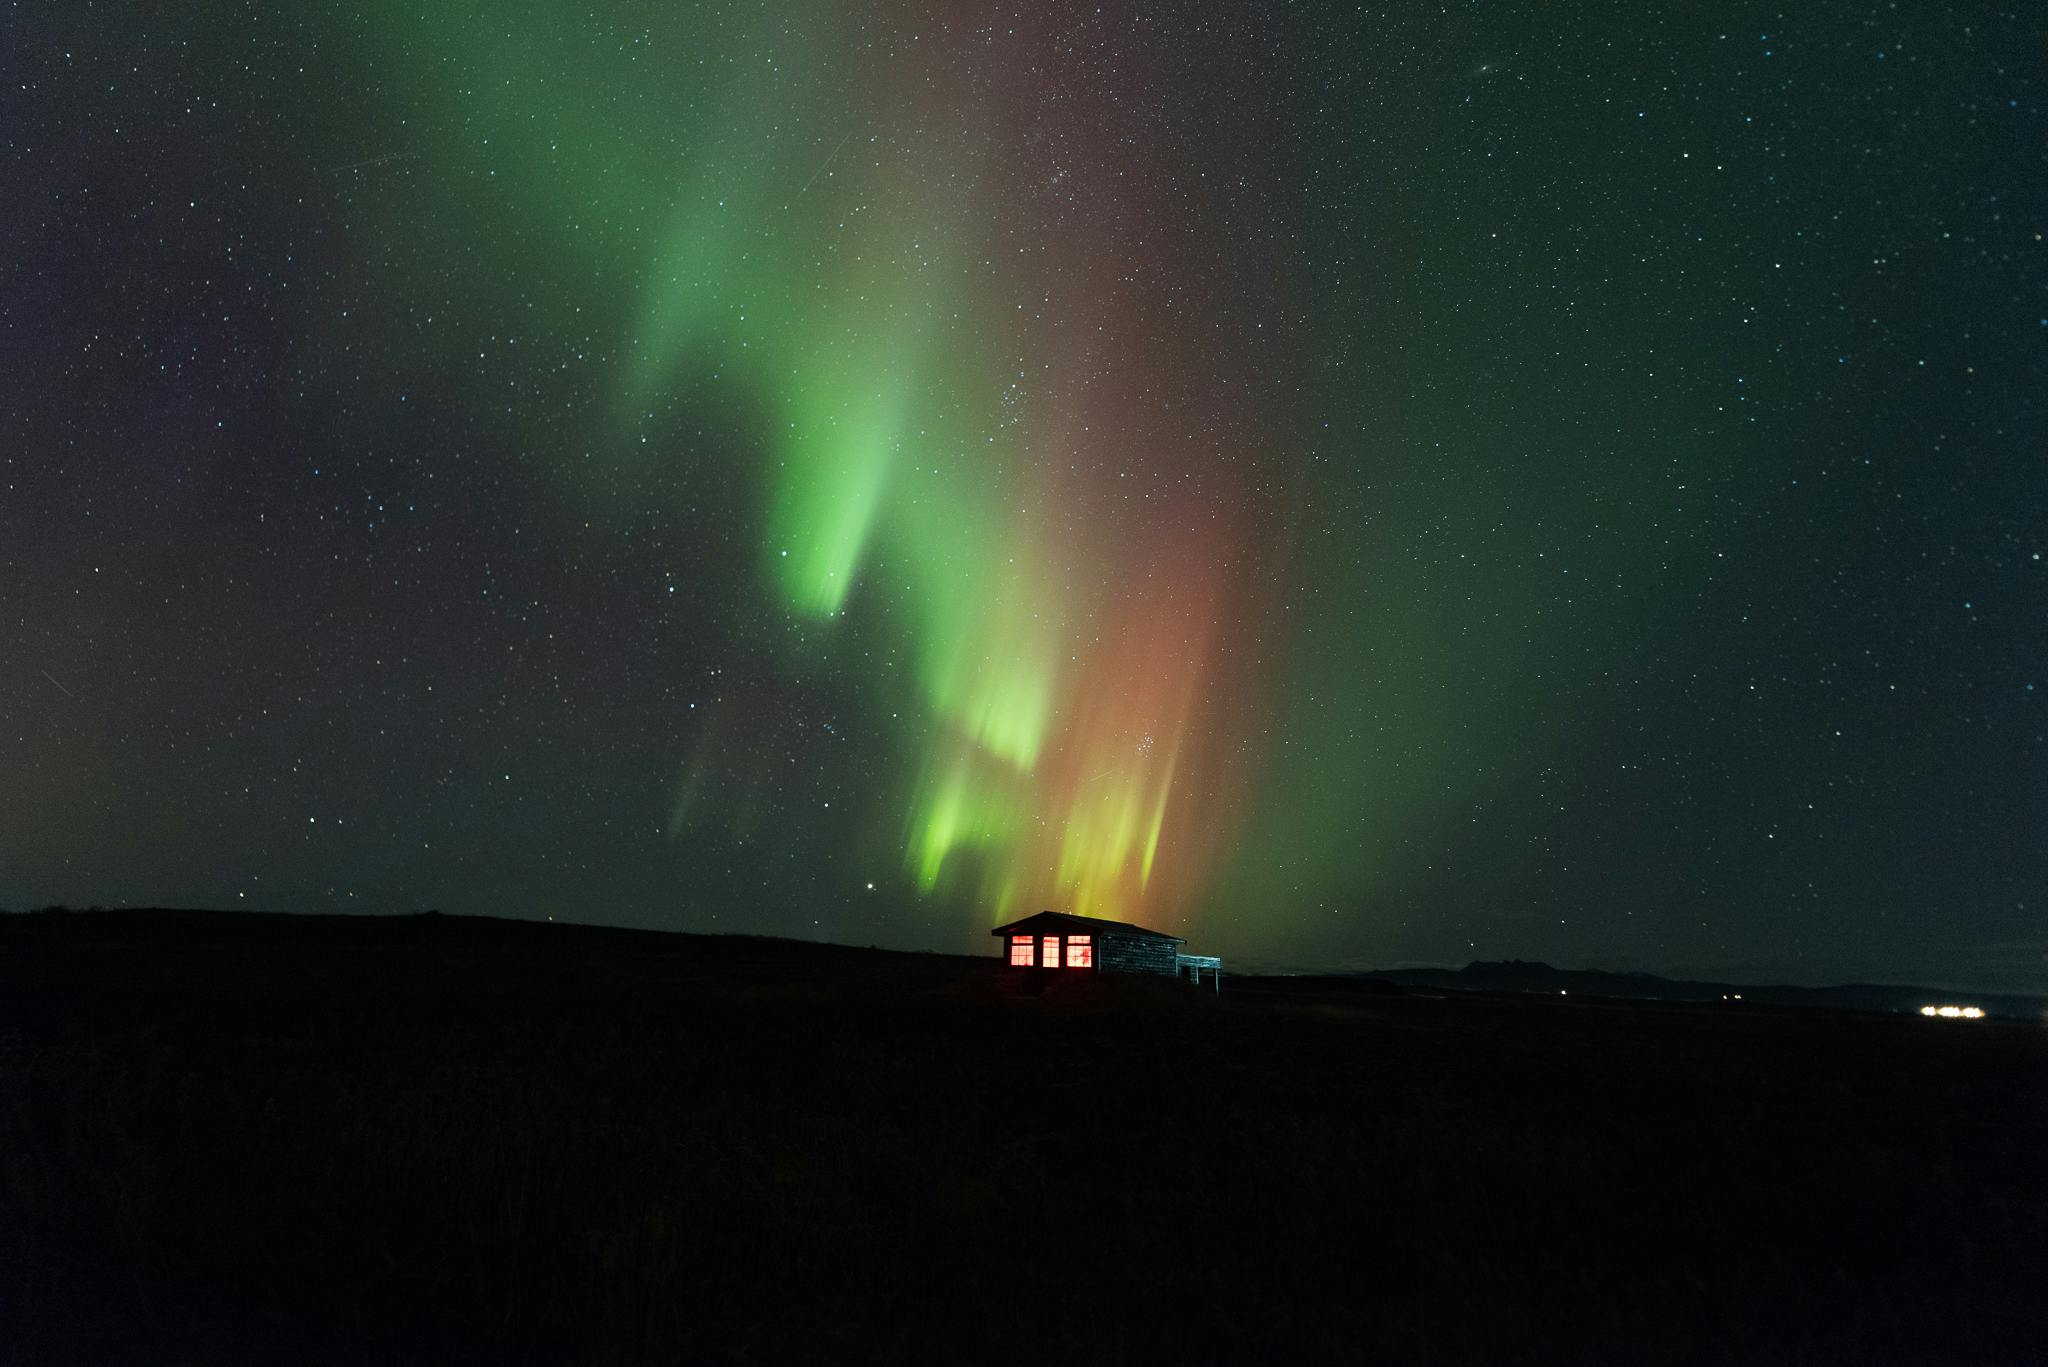
This is especially true in spring and autumn when even slow moving solar wind is enough to spark beautiful aurora, even though the global Kp value says the night is quiet. The image shows a lovely burst of aurora activity when the measured Kp value only reached 1.
So please, don't focus too much on the Kp-index. In fact, ditch it.
What to use then instead? Check the real time space weather data instead. It's a much better indicator of what to expect for the next hour or so.

